Troubleshooting Details
The Troubleshooting Details screen displays a collection of advanced runtime statistics and information used primarily for diagnosing any problems with the MMPI installation.
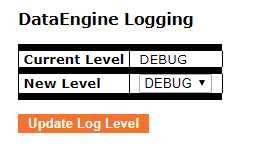
The DataEngine Logging section displays the current logging level as well as a menu that allows an administrator to change the logging level. See Configure Logging for more information about all of the ways MMPI can capture and store logs. The log level can also be changed on that page, but to change it here, select the level from the list and then click the Update Log Level button.
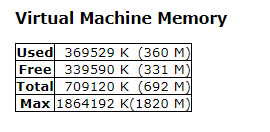
The Virtual Machine Memory section displays information about the amount of memory allocated to the Java virtual machine in which Apache Tomcat is running. This information can be helpful when troubleshooting "Out Of Memory" issues when MMPI is trying to process large print jobs. The maximum amount of memory allocated to Apache Tomcat and by extension MMPI, is configurable. Please contact CYBRA Technical Support for more information.
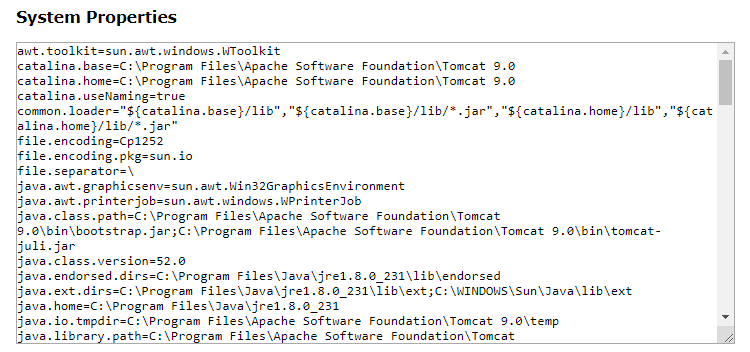
The System Properties section displays all of the server Java system properties. Information about the OS, Java version, certain environment variables, etc can be found here.
The DataEngine Connection Pools section shows information about the current JDBC connection pools. Pool name, Pool URL, Number of Connections and Number of Connection in Use is displayed.
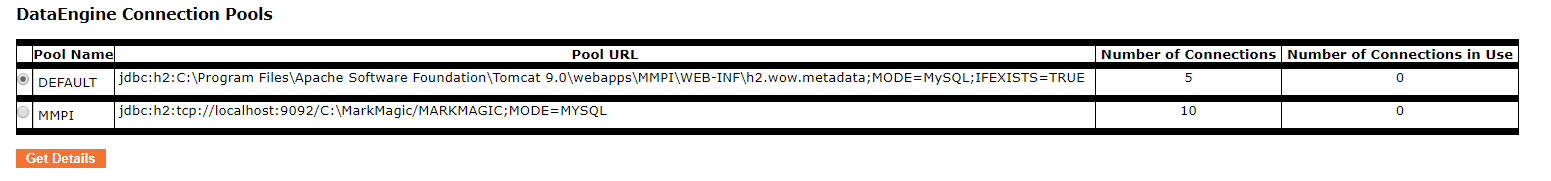
To get advanced information about a connection pool, select the pool with the radio button on the left and then click the Get Details button.
Example:
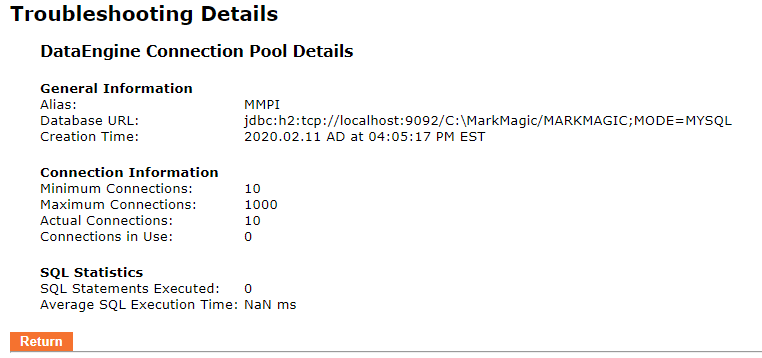
To return back to the Troubleshooting Details screen, click the Return button.